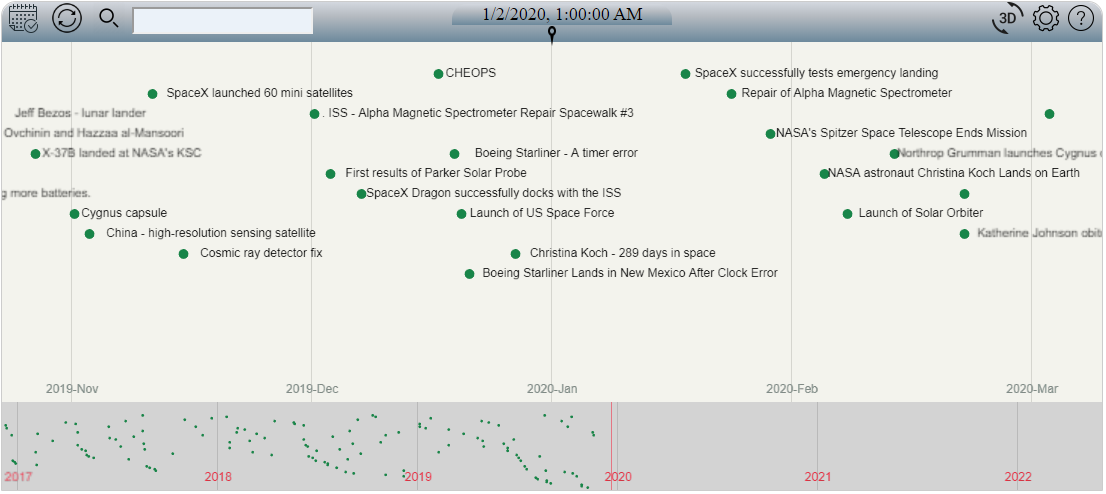
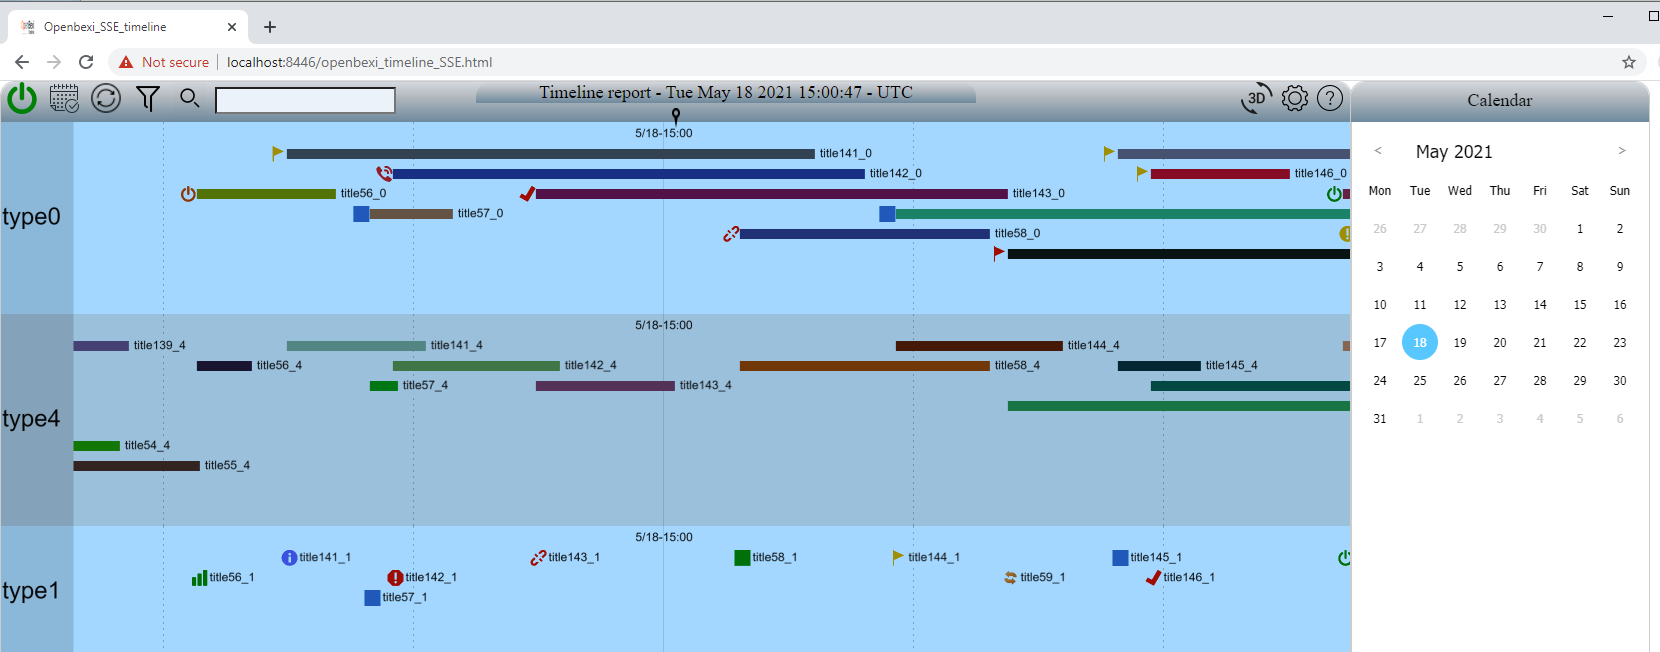
- OpenBEXI Timeline offers a highly customizable user interface along with a data-driven interactive Gantt chart, designed for the effective visualization of temporal data.
- To utilize OpenBEXI Timeline, deploy it using Docker by downloading the image from its Docker Hub repository: OpenBEXI_Timeline Docker Repository.
- For access, launch Edge, Firefox, or Chrome and navigate to either: ** https://localhost:8442/openbexi_timeline.html
Join us in enhancing OpenBEXI Timeline by contributing towards feature development, performance optimization, bug fixes, and more. Your involvement helps us continuously improve and expand the project's capabilities.
OpenBEXI_Timeline is available under the GNU License.